Environmental Data
- GHG Emissions Throughout the Value Chain
- Detailed Data on Resource Input and Environmental Load Output
- Environmental Management Data
- Environmental Accounting
GHG Emissions Throughout the Value Chain
Calculating GHG Emissions Throughout the Value Chain (Fiscal 2023)
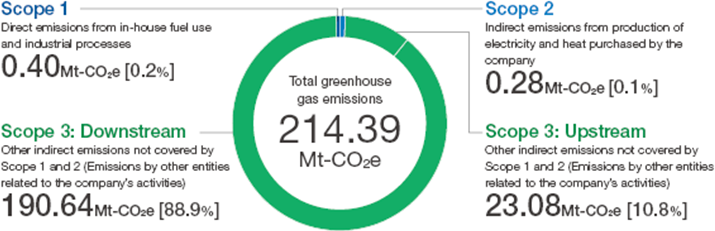
Hitachi calculates greenhouse gas (GHG) emissions throughout the Value chain by referencing GHG Protocol standards. This gives us a good grasp of emission hotspots in our value chain with which we can establish effective targets and reduction measures. Most of the greenhouse gases emitted by Hitachi as a whole are energy-related CO2.
An extremely high share of our value chain emissions comes from the use of the products and services we sell. We thus believe that we can make a major contribution to decarbonization through our businesses by giving priority to enhancing the efficiency and energy-saving features of our products and services.
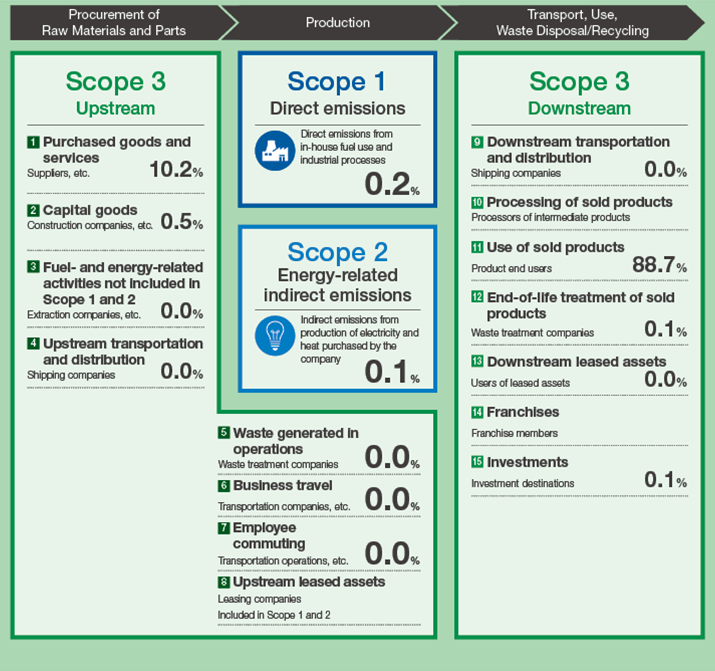
In-house:Within the scope of the company’s organizational boundaries. In principle, all business activities of the company itself and activities within or controlled by its consolidated subsidiaries.
Upstream:In principle, activities related to products and services that are purchased.
Downstream:In principle, activities related to products and services that are sold.
Detailed Data on GHG Emissions Throughout the Hitachi Value Chain (Hitachi Group, Fiscal 2023)
| Category | Description | Reporting Boundary | Emissions(Mt-CO2e) | Percentage(%) |
|---|---|---|---|---|
| Total Scope 1, 2, and 3 | Hitachi Group | 214.38 | 100.0 | |
| Total Scope 1 and 2*1 | Hitachi Group | 0.68 | 0.3 | |
| Scope 1*2 | ||||
| Direct Emissions*1 | Direct emissions from in-house fuel use and industrial processes (Aggregate of categories A, B, and C (excluding non-manufacturing sites for category C)) | Hitachi Group | 0.40 | 0.2 |
| Of which, Category A | Direct emissions from in-house fuel use and industrial processes (Aggregated for category A only) | 0.28 | ー | |
| Scope 2*3 | ||||
| Energy-related Indirect Emissions*1 | Indirect emissions from production of electricity and heat purchased by the company (Aggregate of categories A, B, and C (excluding non-manufacturing sites for category C)) | Hitachi Group | 0.28 | 0.1 |
| Of which, Category A | Indirect emissions from production of electricity and heat purchased by the company (Aggregated for category A only) | 0.20 | ー | |
| Scope 3 Total | Hitachi Group | 213.70 | 99.7 | |
| Scope 3 Upstream (other Indirect Emissions) | ||||
| 1 Purchased Goods and Services | Emissions from the resource extraction stage to the manufacturing stage, including raw materials, parts, supplied products, and sales | Hitachi Group | 21.80 | 10.2 |
| 2 Capital Goods | Emissions generated in the construction, manufacture, and shipping of the company’s own capital goods, such as equipment, devices, buildings, facilities, and vehicles | 1.11 | 0.5 | |
| 3 Fuel- and Energy- related Activities not included in Scope 1 and 2 | Emissions from procuring the fuel necessary for electricity and other energy production, including resource extraction, production, and shipping | 0.05 | 0.0 | |
| 4 Upstream Transportation and Distribution | Emissions from the distribution of raw materials, parts, products supplied, and sales prior to the delivery of materials to the company, as well as other distribution activities of products for which the company bears the expense | 0.02 | 0.0 | |
| 5 Waste Generated in Operations | Emissions from the transportation, disposal, and treatment of waste generated from the company’s operations | 0.01 | 0.0 | |
| 6 Business Travel | Emissions generated from the fuel and electricity used by employees for business travel | 0.04 | 0.0 | |
| 7 Employee Commuting | Emissions generated from the fuel and electricity used by employees commuting | 0.05 | 0.0 | |
| 8 Upstream Leased Assets | Emissions from the operation of assets leased by the company, excluding those counted in Scope 1 and 2 | Included in Scope 1 and 2 | ー | |
| Scope 3: Downstream (other Indirect Emissions) | ||||
| 9 Downstream Transportation and Distribution | Emissions from the transportation, storage, loading and unloading, and retail sales of products | Hitachi Group | 0.07 | 0.0 |
| 10 Processing of Sold Products | Emissions by downstream companies during the processing of intermediate products | N/A*4 | ー | |
| 11 Use of Sold Products*5 | Emissions from the use of products by end users, such as consumers and businesses | 190.20 | 88.7 | |
| 12 End-of-life Treatment of Sold Products Sold | Emissions from the transportation, waste disposal, and treatment of products by end users, such as consumers and businesses | 0.19 | 0.1 | |
| 13 Downstream Leased Assets | Emissions from the operating of assets owned by the reporting company as the lessor, which are leased to other entities | 0.02 | 0.0 | |
| 14 Franchises | Emissions by franchises under Scope 1 and 2 | N/A | ー | |
| 15 Investments | Emissions related to the management of investments | 0.15 | 0.1 | |
Note:Due to the deconsolidation of auto parts-related companies, the company's figures are not included in the totals for fiscal 2023.
*1Aggregated according to Hitachi's internal categories A, B, and C (excluding non-manufacturing sites for category C). The row labeled “Of which, category A” is aggregated for category A only. In the text, unless otherwise noted, the aggregation pertains to category A, which is subject to environmental management.
*2Including SF6, PFC, HFC, N2O, NF3, and CH4. The gas and fuel oil conversion factors are based on the List of calculation methods and emission factors used in the Greenhouse Gas Emissions Calculation, Reporting and Publication System.
*3CO2 emissions from electricity consumption is calculated using a market-based calculation method. CO2 electrical power conversion factors: We used adjusted conversion factors for individual power businesses based on the Act on Promotion of Global Warming Countermeasures in Japan. In China, we used the average emissions factor published by the government for the regional power grid. For other countries, we used the latest values for each fiscal year supplied by the International Energy Agency (IEA) for individual countries or by power supply companies.
*4Cannot be determined due to insufficient information about the processing.
*5Emissions are calculated based on the annual energy consumption of each product, multiplied by the number of units sold, the product's lifetime, and the CO2 emission factor. The CO2 emission factor used is based on the country-specific emission factors (mainly 2021 version) provided by the IEA.
Detailed Data on Resource Input and Environmental Load Output
Energy Inputs and GHG Emissions During Business Operations
The following is an outline of the energy consumed during Hitachi’s business operations and the part of our environmental load consisting of greenhouse gas (GHG) emissions.
Energy Inputs
| Reporting Boundary | Unit | FY2019 | FY2020 | FY2021 | FY2022*1 | FY2023*3 | |||
|---|---|---|---|---|---|---|---|---|---|
| Energy Inputs | Hitachi Group | GWh | 12,427 | 9,674 | 9,957 | 5,387 | 3,291 | ||
| Renewable Energy | Electricity | Total | Hitachi Group | GWh | 18 | 138 | 193 | 706 | 769 |
| (Self-generated amount) | Hitachi Group | GWh | 18 | 22 | 34 | 25 | 29 | ||
| Purchases: Includes non-fossil certificates) | Hitachi Group | GWh | ー | 116 | 159 | 681 | 741 | ||
| Non-renewable Energy | Electricity | Electricity | Hitachi Group | GWh | 5,992 | 4,498 | 4,584 | 2,218 | 715 |
| Fuel and heat*2 | City gas | Hitachi Group | GWh (billion m3) |
1,933 (0.15) | 1,339 (0.11) | 1,373 (0.11) | 767 (0.06) | 665(0.06) | |
| LPG、LNG | Hitachi Group | GWh(kt) | 2,015 (150) | 1,646 (111) | 1,705 (118) | 1,217 (82) | 989(65) | ||
| Other natural gas | Hitachi Group | GWh (billion m3) |
258 (0.02) | 276 (0.02) | 319 (0.03) | 261 (0.02) | 46(0.004) | ||
| Fuel oil (heavy oil, kerosene, etc.) | Hitachi Group | GWh (ML) | 792 (75) | 653 (61) | 495 (47) | 197 (19) | 95(9) | ||
| Solid fuel (coke) | Hitachi Group | GWh (kt) | 1,333 (162) | 1,111 (137) | 1,278 (156) | ー | ー | ||
| Steam, hot water and cold water | Hitachi Group | GWh (PJ) | 86 (0.31) | 13 (0.05) | 10 (0.04) | 21 (0.08) | 12(0.04) | ||
Note: Aggregated for category A only until fiscal 2022 according to Hitachi's internal categories. Aggregated for categories A, B, and C (excluding non-manufacturing sites for category C) for fiscal 2023 according to Hitachi's internal categories.
*1Significant decrease for fiscal 2022 due to deconsolidation of materials-related and construction machinery-related companies.
*2Used 3.6MJ/kWh in the conversion from calorific value.
*3In fiscal 2023, the amount decreased due to the deconsolidation of the auto parts-related companies.
Greenhouse Gases Emitted
| Reporting Boundary | Unit | FY2019 | FY2020 | FY2021 | FY2022*1 | FY2023*3 | |||
|---|---|---|---|---|---|---|---|---|---|
| Total Greenhouse Gases*2 | Hitachi Group | kt-CO2e | 4,415 | 3,313 | 3,412 | 1,565 | 676 | ||
| Energy-related Total CO2 Emissions | Total | Hitachi Group | kt-CO2 | 4,374 | 3,296 | 3,384 | 1,538 | 618 | |
| (Direct emissions) | Hitachi Group | kt-CO2 | 1,489 | 1,202 | 1,245 | 459 | 339 | ||
| (Indirect emissions) | Hitachi Group | kt-CO2 | 2,885 | 2,094 | 2,139 | 1,079 | 279 | ||
| Total other than Energy-related CO2 Greenhouse gas Emissions*4 | Total | Hitachi Group | kt-CO2e | 41 | 17 | 28 | 26.7 | 58.6 | |
| Sulfur hexafluoride (SF6) | Hitachi Group | kt-CO2e | 24 | 11 | 20 | 22.0 | 33.2 | ||
| Perfluorocarbons (PFC) | Hitachi Group | kt-CO2e | 4 | 0 | 2 | 1.3 | 0.9 | ||
| Hydrofluorocarbons (HFC) | Hitachi Group | kt-CO2e | 3 | 1 | 3 | 2.4 | 22.5 | ||
| Dinitrogen monoxide, nitrogen trifluoride, methane (N2O ,NF3,CH4) | Hitachi Group | kt-CO2e | 2 | 2 | 3 | 0.9 | 1.9 | ||
| CO2 from non-energy sources | Hitachi Group | kt-CO2e | 8 | 3 | 0 | 0.2 | 0.2 | ||
Note: CO2 emissions from electricity consumption is calculated using a market-based calculation method. CO2 emission coefficients for Japan (including power plants) are the latest adjusted emission coefficients for each electric utility based on the Act on Promotion of Global Warming Countermeasures. For China, we use the average emissions factor for the regional power grid published by the government. For countries other than Japan and China, we use the latest IEA emission factors by country for each fiscal year or the latest factors provided by power supply companies.
Note: The gas and fuel oil conversion factors are based on the list of calculation methods and emission factors used in the Greenhouse Gas Emissions Calculation, Reporting and Publication System.
Note: Aggregated for category A only until fiscal 2022 according to Hitachi's internal categories. Aggregated for categories A, B, and C (excluding non-manufacturing sites for category C) for fiscal 2023 according to Hitachi's internal categories.
*1Significant decrease for fiscal 2022 due to deconsolidation of materials-related and construction machinery-related companies.
*2Total GHGs: Scope 1 and 2 total
*3In fiscal 2023, the amount decreased due to the deconsolidation of the auto parts-related companies. HFC emissions saw a significant increase as recycling-related companies were added to the aggregation scope.
*4The sources included in the calculation of greenhouse gas emissions other than energy-related CO2, are as follows: carbon dioxide from cooling and welding applications, methane used for research purposes, hydrofluorocarbons (HFC), perfluorocarbons (PFC), sulfur hexafluoride (SF6), methane, nitrogen trifluoride (NF3), dinitrogen monoxide (N2O) from the manufacture of semiconductor devices and testing of semiconductor inspection equipment, hydrofluorocarbons from the recovery of HFCs during the disposal of refrigeration and air conditioning equipment, sulfur hexafluoride from the production, filling, and testing of high-voltage transformers and power transmission and distribution equipment.
Raw Material Inputs and Waste and Valuables Generation During Business Operations
The following is an outline of the raw materials used during Hitachi’s business operations and the part of our environmental load consisting of the generation of waste and valuables.
Raw Material Inputs
| Reporting Boundary | Unit | FY2019 | FY2020 | FY2021 | FY2022*1 | FY2023*2 | |||
|---|---|---|---|---|---|---|---|---|---|
| Total Amount of Raw Materials | Hitachi Group | kt | 3,776 | 3,066 | 3,235 | 788 | 3,345 | ||
| Raw Materials | Metals | Total metals | Hitachi Group | kt | 3,454 | 2,861 | 3,083 | 685 | 2,430 |
| New materials | Hitachi Group | kt | 1,372 | 1,075 | 909 | 614 | 2,428 | ||
| Recycled materials, etc. | Hitachi Group | kt | 2,082 | 1,786 | 2,175 | 71 | 2 | ||
| Plastics | Total plastics | Hitachi Group | kt | 147 | 115 | 74 | 43 | 148 | |
| New materials | Hitachi Group | kt | 143 | 113 | 72 | 40 | 146 | ||
| Recycled materials, etc. | Hitachi Group | kt | 4 | 2 | 2 | 3 | 2 | ||
| Other materials | Total other materials | Hitachi Group | kt | 175 | 90 | 77 | 61 | 767 | |
| New materials | Hitachi Group | kt | 173 | 89 | 76 | 54 | 766 | ||
| Recycled materials, etc. | Hitachi Group | kt | 2 | 1 | 1 | 7 | 0.1 | ||
*1Significant decrease for fiscal 2022 due to deconsolidation of materials-related and construction machinery-related companies.
*2In fiscal 2023, the amount from the deconsolidated auto parts-related companies was excluded, while the inclusion of raw material input amount from an energy-related company, which has been consolidated since fiscal 2020, drove a significant increase in the total.
Waste and Valuables Generated
| Reporting Boundary | Unit | FY2019 | FY2020 | FY2021 | FY2022*1,2 | FY2023*3 | |||
|---|---|---|---|---|---|---|---|---|---|
| Total Waste and Valuables Generated | Total / (hazardous) | Hitachi Group | kt | 1,302 /(56) | 1,061 /(49) | 1,111 /(61) | 356 /(57) | 164 /(13) | |
| Waste Reduction | Hitachi Group | kt | 101 /(17.5) | 75 /(9.8) | 74 /(10.5) | 47 /(23.1) | 11 /(4.4) | ||
| Recycle | Reuse | Hitachi Group | kt | 5 /(2.2) | 35 /(11.4) | 36 /(18.7) | 18 /(6.2) | 7 /(0.3) | |
| Materials recycled | Hitachi Group | kt | 919 /(25.3) | 740 /(17.6) | 784 /(19.3) | 256 /(16.7) | 131 /(6.0) | ||
| Thermal recovery | Hitachi Group | kt | 21 /(4.9) | 11 /(5.4) | 13 /(6.5) | 16 /(4.6) | 11 /(1.6) | ||
| Landfill | Hitachi Group | kt | 256 /(6.1) | 200 /(4.9) | 204 /(5.7) | 20 /(6.5) | 4 /(0.6) | ||
Note:Figures in parentheses are the generation of waste defined as hazardous under the Basel Convention. The amount of hazardous substances in parentheses is indicated as internal figures.
*1Significant decrease due to deconsolidation of materials-related and construction machinery-related companies.
*2The amount for fiscal 2022 includes the amount of waste and valuables generated by energy companies and auto parts-related companies that have become consolidated subsidiaries since fiscal 2020.
*3In fiscal 2023, the amount decreased due to the deconsolidation of the auto parts-related companies.
Water Inputs and Effluent Discharges and Consumption During Business Operations
The following is an outline of the total amount of water resources and consumption used during Hitachi’s business operations and the part of our environmental load consisting of effluent discharges.
Water Input
| Reporting Boundary | Unit | FY2019 | FY2020 | FY2021 | FY2022*2,3 | FY2023*5 | |||
|---|---|---|---|---|---|---|---|---|---|
| Total Water Withdrawal*1 | Hitachi Group | Million m3 | 36.41 | 26.35 | 26.03 | 14.23 | 10.59 | ||
| Surface Water | Tap water (water for drinking and other household uses) | Hitachi Group | Million m3 | 7.95 | 5.10 | 5.23 | 5.53 | 2.37 | |
| Industrial water, river water | Hitachi Group | Million m3 | 15.58 | 12.62 | 12.47 | 5.17 | 5.28 | ||
| Rain water | Hitachi Group | Million m3 | 0.02 | 0.01 | 0.01 | 0.01 | 0.01 | ||
| Groundwater | Hitachi Group | Million m3 | 12.84 | 8.60 | 8.32 | 3.52 | 2.93 | ||
| Recycled Water (Recycled from the Wastewater of other Organizations) | Hitachi Group | Million m3 | 0.02 | 0.01 | 0.01 | 0.00 | 0.00 | ||
Water Effluents Discharged
| Reporting Boundary | Unit | FY2019 | FY2020 | FY2021 | FY2022*2,3 | FY2023*4,5,6 | |||
|---|---|---|---|---|---|---|---|---|---|
| Total Water Effluents Discharged | Hitachi Group | Million m3 | 31.09 | 21.24 | 21.25 | 12.15 | 9.14 | ||
| Public Water | Hitachi Group | Million m3 | 22.46 | 15.28 | 15.40 | 8.26 | 6.30 | ||
| Sewerage | Hitachi Group | Million m3 | 7.74 | 5.44 | 5.31 | 3.76 | 2.75 | ||
| Groundwater | Hitachi Group | Million m3 | 0.89 | 0.52 | 0.54 | 0.12 | 0.09 | ||
| Water Quality | BOD (biochemical oxygen demand) | Hitachi Group | t | 232 | 204 | 156 | 77 | 9 | |
| COD (chemical oxygen demand) | Hitachi Group | t | 400 | 406 | 301 | 137 | 2 | ||
Consumption
| Reporting Boundary | Unit | FY2019 | FY2020 | FY2021 | FY2022*2,3 | FY2023*5 | |||
|---|---|---|---|---|---|---|---|---|---|
| Total Consumption | Hitachi Group | Million m3 | 5.32 | 5.11 | 4.78 | 2.08 | 1.45 | ||
| Contained in Products | Hitachi Group | Million m3 | 0.07 | 0.14 | 0.00 | 0.00 | 0.00 | ||
| Contained in Waste | Hitachi Group | Million m3 | 0.05 | 0.01 | 0.01 | 0.00 | 0.00 | ||
| Evaporation, etc. | Hitachi Group | Million m3 | 5.20 | 4.96 | 4.77 | 2.08 | 1.45 | ||
*1Figures through fiscal 2021 represent water usage in manufacturing processes and general daily usage at manufacturing sites classified as Category A within Hitachi, as well as general daily usage in locations other than manufacturing sites. Figures for fiscal 2022 and onward represent water usage in manufacturing processes and daily general usage at Category A manufacturing sites.
*2Fiscal 2022 water usage of an energy-related and auto parts-related companies included in the scope of consolidation since fiscal 2020 is included in the reported figures above.
*3Significant decrease in fiscal 2022 due to deconsolidation of materials-related and construction machinery-related companies.
*4For fiscal 2023, the above reported values include BOD/COD of energy companies that have been consolidated since fiscal 2020.
*5In fiscal 2023, the amount decreased due to the deconsolidation of the auto parts-related companies.
*6Water quality for fiscal 2023 decreased due to a revision in the aggregation method. This revision excluded discharges to sewage systems and counted only either BOD or COD for the same discharge destination.
Inputs and Discharges of Chemical Substances During Business Operations
The following is an outline of the chemical substances handled during Hitachi’s business operations and the part of our environmental load consisting of chemical substance discharges.
Chemical Substances Handled
| Reporting Boundary | Unit | FY2019 | FY2020 | FY2021 | FY2022*3 | FY2023*5 | |||
|---|---|---|---|---|---|---|---|---|---|
| Total Chemical Substances Handled*1 | Chemical substances handled | Hitachi Group | kt | 83.68 | 47.49*2 | 26.20 | 1.70 | 0.97 | |
Chemical Substances Discharged
| Reporting Boundary | Unit | FY2019 | FY2020 | FY2021 | FY2022*3 | FY2023*5 | |||
|---|---|---|---|---|---|---|---|---|---|
| Total Chemical Substances Discharged | Hitachi Group | kt | 4.98 | 3.27 | 3.50 | 1.39 | 0.65 | ||
| Chemical Substances Discharged | Chemical substances discharged*4(VOC, etc.) | Hitachi Group | kt | 3.88 | 2.37 | 2.50 | 1.09 | 0.62 | |
| SOx (sulfur oxides) | Hitachi Group | kt | 0.3 | 0.2 | 0.2 | 0.01 | 0.00 | ||
| NOx (nitrogen oxides) | Hitachi Group | kt | 0.8 | 0.7 | 0.8 | 0.29 | 0.03 | ||
Note:Sulfur oxides (SOx) and nitrogen oxides (NOx) are chemical emissions that are released from the combustion of fuel, not due to the chemicals used.
*1We selected 50 substances from the perspective of hazards and atmospheric emissions.
*2Significant decrease due to deconsolidation of a materials-related company.
*3Significant decrease in fiscal 2022 due to deconsolidation of materials-related and construction machinery-related companies.
*4Approximately 100% of chemical emissions classified as VOCs.
*5In fiscal 2023, the amount decreased due to the deconsolidation of the auto parts-related companies.
Environmental Management Data
Number of ISO 14001 Certified Companies (Hitachi Group, as of March 2024)
| Reporting Boundary | Unit | FY2020 | FY2021 | FY2022*1 | FY2023*2 | |||
|---|---|---|---|---|---|---|---|---|
| Total | Hitachi Group | Companies | 202 | 185 | 281 | 178 | ||
| Japan | Hitachi Group | Companies | 85 | 66 | 66 | 45 | ||
| China | 43 | 43 | 61 | 47 | ||||
| ASEAN, India, and the rest of Asia | 42 | 43 | 50 | 34 | ||||
| North America | 10 | 9 | 13 | 15 | ||||
| Europe | 17 | 15 | 52 | 27 | ||||
| Other | 5 | 9 | 39 | 10 | ||||
Note:Companies with at least one certified business site.
*1Significant changes in fiscal 2022 resulting from both the increase caused by the consolidation of an energy-related company and the decrease caused by the deconsolidation of materials-related and construction machinery-related companies.
*2In fiscal 2023, the amount decreased due to the deconsolidation of the auto parts-related companies.
Number of Regulatory Violations and Complaints
| Reporting Boundary | Unit | FY2019 | FY2020 | FY2021 | FY2022 | FY2023 | |||
|---|---|---|---|---|---|---|---|---|---|
| Regulatory Violations | Water quality | Hitachi Group | Cases | 4 | 5 | 2 | 0 | 1 | |
| Air quality | 0 | 0 | 0 | 2 | 0 | ||||
| Waste materials | 0 | 4 | 3 | 0 | 2 | ||||
| Other (equipment registration, etc.) | 1 | 1 | 3 | 0 | 0 | ||||
| Complaints | Hitachi Group | Cases | 5 | 3 | 3 | 0 | 1 | ||
Environmental Accounting
Environmental Protection Costs
| Reporting Boundary | Unit | FY2019 | FY2020 | FY2021 | FY2022*2 | FY2023*3 | |||
|---|---|---|---|---|---|---|---|---|---|
| Total | Hitachi Group | Billion Yen | 105.71 | 86.62 | 79.97 | 57.21 | 44.35 | ||
| Expenses | Business area | Maintenance costs for equipment with low environmental loads, depreciation, etc.*1 | Hitachi Group | Billion Yen | 22.62 | 19.14 | 19.56 | 6.30 | 4.55 |
| Upstream/ Downstream | Green procurement expenses, recovery and recycling of products and packaging, recycling expenses | 0.68 | 0.62 | 0.64 | 0.08 | 0.06 | |||
| Administration | Labor costs for environmental management and the implementation and maintenance of environmental management systems | 4.98 | 5.88 | 5.40 | 3.06 | 3.14 | |||
| Research and development | Costs of research and development and product designs to reduce the environmental burden caused by products and production processes | 77.01 | 60.64 | 53.79 | 47.55 | 36.37 | |||
| Social activities | Planting, beautification, and other environmental improvement costs | 0.25 | 0.22 | 0.26 | 0.11 | 0.15 | |||
| Environmental remediation | Environmental mitigation costs, contributions, and charges | 0.17 | 0.12 | 0.32 | 0.11 | 0.08 | |||
*1Equipment depreciation costs are calculated using the straight-line method over five years.
*2Fiscal 2022 does not include the costs of an energy-related company that became consolidated since fiscal 2020. Significant decrease due to deconsolidation of materials-related and construction machinery-related companies.
*3In fiscal 2023, the amount decreased due to the deconsolidation of the auto parts-related companies.
Environmental Protection Effects
Economic Effects*1
| Major FY2023 Activities | Reporting Boundary | Unit | FY2019 | FY2020 | FY2021 | FY2022*2 | FY2023*3 | ||
|---|---|---|---|---|---|---|---|---|---|
| Total | Hitachi Group | Billion Yen | 18.62 | 14.28 | 19.20 | 11.95 | 1.65 | ||
| Net Income Effects | Recovering value from waste by sorting and recycling | Hitachi Group | Billion Yen | 12.42 | 9.66 | 15.15 | 7.89 | 1.15 | |
| Cost Reduction Effects | Installing high-efficiency equipment (lighting, power supply, etc.) | 6.20 | 4.62 | 4.05 | 4.06 | 0.50 | |||
*1
Economic effects include the following:
Net income effects: Real income from the sale of valuable materials and environmental technology patents.
Cost reduction effects: Reductions in electricity, waste treatment, and other expenses through activities that reduce environmental loads.
*2Fiscal 2022 does not include FY2022 costs of energy-related companies that became consolidated since fiscal 2020. Significant decrease due to deconsolidation of materials-related and construction machinery-related companies.
*3In fiscal 2023, the amount decreased due to the deconsolidation of the auto parts-related companies.
Environmental Liability
As the amounts that we can reasonably project as future environmental liabilities as of end of April 2024, we recorded 3.4 billion yen in costs for the disposal of waste containing PCBs and 1 billion yen to clean up contaminated soil.